


The Economic Burden of Racial, Ethnic, and Educational Health Disparities in the U.S., 2018
In the United States, health disparities exist by race and ethnicity and by educational level due to differential exposure to environmental risks and access to health care and socioeconomic opportunities and resources.
Compared to 2014, when estimated that the economic burden of racial and ethnic health disparities in the United States was $320 billion, a new, follow-up study funded by NIMHD estimates the 2018 economic burden at $451 billion. This new study also estimates the burden of education-related health disparities at $978 billion.
Society incurs cost when health disparities are unaddressed, and this cost is growing.
Total burden estimated to be
$451B
Nationwide
![]()
$1,377
Per Person
![]()
This is equivalent to
Total burden estimated to be
$978B
Nationwide
![]()
$2,988
Per Person
![]()
This is equivalent to
*GDP: Gross domestic product. GDP measures the size and growth of an economy.
The researchers concluded that the economic burden of health disparities in the United States is high—highlighting the need for policies and interventions that promote health equity, especially among populations experiencing health disparities.
Key Findings
- The total economic burden of health disparities is high.
- The burden varies by educational level and by race and ethnicity.
- The economic burden of racial and ethnic and education-related health disparities varies by state.
Study Recommendations
- Federal and state health policymakers and offices of minority health can use these estimates to inform areas where policies and programs are most needed to address health disparities as well as take remedial actions to reduce them.
- State policymakers can look at the magnitude of the economic burden across racial and ethnic and education groups within their states and compare this to the size of their economy.
Go to economic burden details by: Race and ethnicity | Educational level
(Each broken out by national and state estimates)
Key Contributions
- This study is the first to provide estimates of the economic burden of health disparities at the national level and for all 50 states and the District of Columbia.
- Where prior estimates did not include American Indian/Alaska Native and Native Hawaiian/Pacific Islander populations, this study estimates the economic burden of health disparities for 5 racial and ethnic minority groups.
- It provides estimates of the economic burden of health disparities for adults without a 4-year college degree.
Background
In the United States, health disparities exist by race and ethnicity and by educational attainment due to differential exposure to environmental risks and access to health care and socioeconomic opportunities and resources.
Compared to more advantaged groups, people from racial and ethnic minority groups are more likely to live in segregated and disadvantaged neighborhoods, largely due to structural discrimination and racism. Structural discrimination and racism in workplaces, schools, health care settings, and daily life can increase the exposure of people from racial and ethnic minority groups to unhealthy, unsafe, low-resource environments that limit access to treatment and preventive health care, which in turn, increases their risks for morbidity and mortality.
Among adults without a 4-year college degree, life expectancy has declined. Life expectancy—the average number of years a person is expected to live—is 78 years in the United States. Adults without a 4-year college degree also suffer higher rates of morbidity than adults with a 4-year college degree.
When people experience high levels of poor health, chronic diseases, and disabilities—coupled with low access to quality health care—these can result in more spending for medical care, lower labor market productivity, and premature deaths.
Approach
The researchers estimated the economic burden of health disparities for 5 racial and ethnic minority groups and 3 education groups using:
- Excess medical care costs
- Lost labor market productivity
- Premature deaths
Racial and ethnic minority groups:
- Asian
- American Indian/Alaska Native
- Black/African American
- Hispanic/Latino
- Native Hawaiian/Pacific Islander
Education groups:
- Adults with less than high school/GED
- Adults with high school/GED
- Adults with some college
Economic Burden by Racial and Ethnic Minority Groups
National Estimates
The total burden of racial and ethnic health disparities was $451 billion and $1,377 per person. At about 2% of the U.S. GDP, this was comparable to the annual growth rate of the economy in 2018.
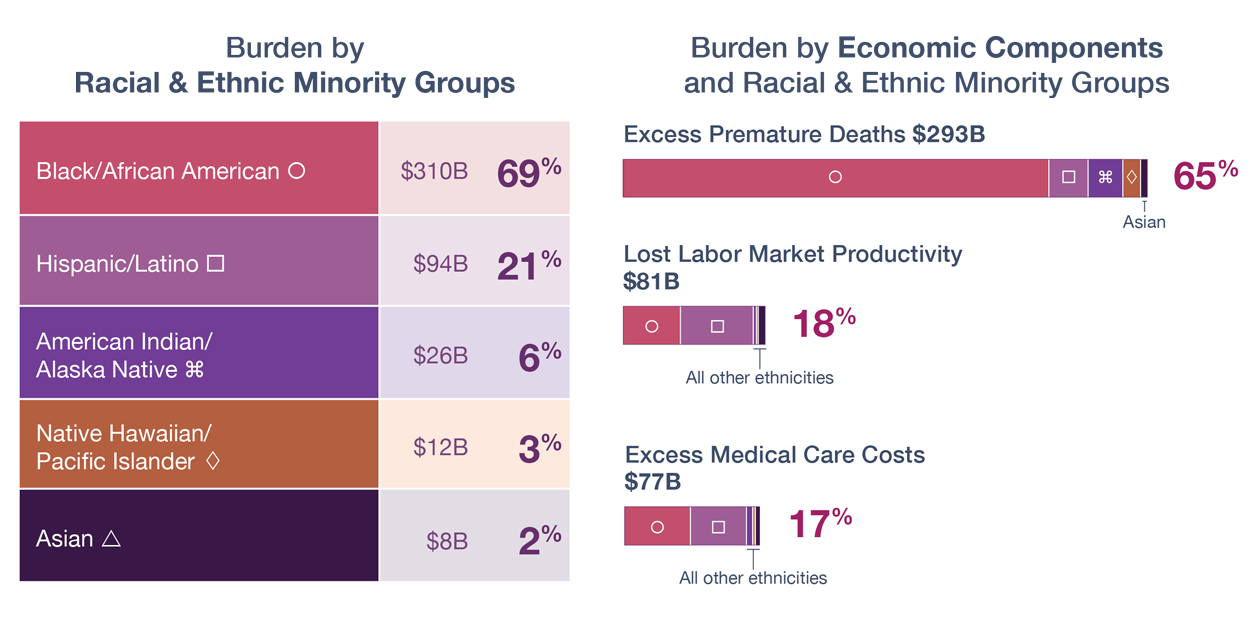
Across all racial and ethnic groups (except Asian), the highest to lowest burden was by:
- Premature deaths (65%)
- Lost labor market productivity (18%)
- Excess medical care costs (17%)
Burden borne by each racial and ethnic group, most to least:
- Black/African American (69%)
- Hispanic/Latino (21%)
- American Indian/Alaska Native (6%)
- Native Hawaiian/Pacific Islander (3%)
- Asian (2%)
- Although the bulk of the burden was borne by the Black/African American population, the burden borne by the American Indian/Alaska Native and Native Hawaiian/Pacific Islander populations exceeded their share of the population.
Racial and ethnic groups that bore the most burden by economic components:
- Most burden from premature deaths:
- Native Hawaiian/Pacific Islander (90%)
- Black/African American (77%)
- American Indian/Alaska Native (74%)
- Most burden from excess medical care costs:
- Asian (55%)
- Most burden from lost labor market productivity:
- Hispanic/Latino (43%)
State Estimates
Racial and ethnic groups with highest burden by number of states:
- Black/African American (33 states)
- Hispanic/Latino (9 states)
- American Indian/Alaska Native (8 states)
- Native Hawaiian/Pacific Islander (1 state)
Five states with the highest burden were among the most populous states:
- Texas ($41 billion)
- California ($40 billion)
- Illinois ($29 billion)
- Florida ($27 billion)
- Georgia ($21 billion)
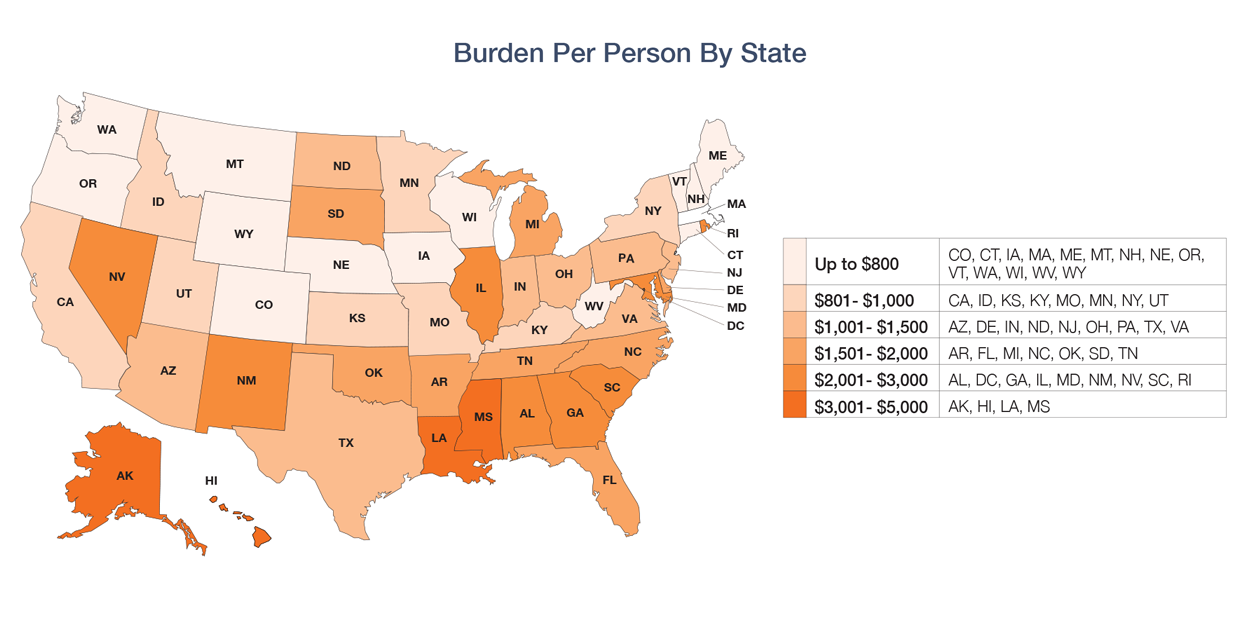
Per person, from lowest to highest, the burden varied substantially:
- $76 (Vermont)
- $4,965 (District of Columbia)
States with the highest and lowest burden relative to their GDP:
- Burden equivalent to 5% or more of GDP:
- Mississippi (8.89%)
- Alabama (6.12%)
- Louisiana (5.99%)
- New Mexico (5.85%)
- Nevada and South Carolina (5.18%)
- Burden equivalent to less than 0.6% of GDP:
- Vermont (0.14%)
- New Hampshire (0.33%)
- Maine (0.43%)
- West Virginia (0.51%)
- Wyoming (0.58%)
Economic Burden by Educational Levels
National Estimates
The total burden of education-related health disparities was $978 billion and $2,988 per person. At about 5% of the U.S. GDP, this was 2 times the annual growth rate of the economy in 2018.
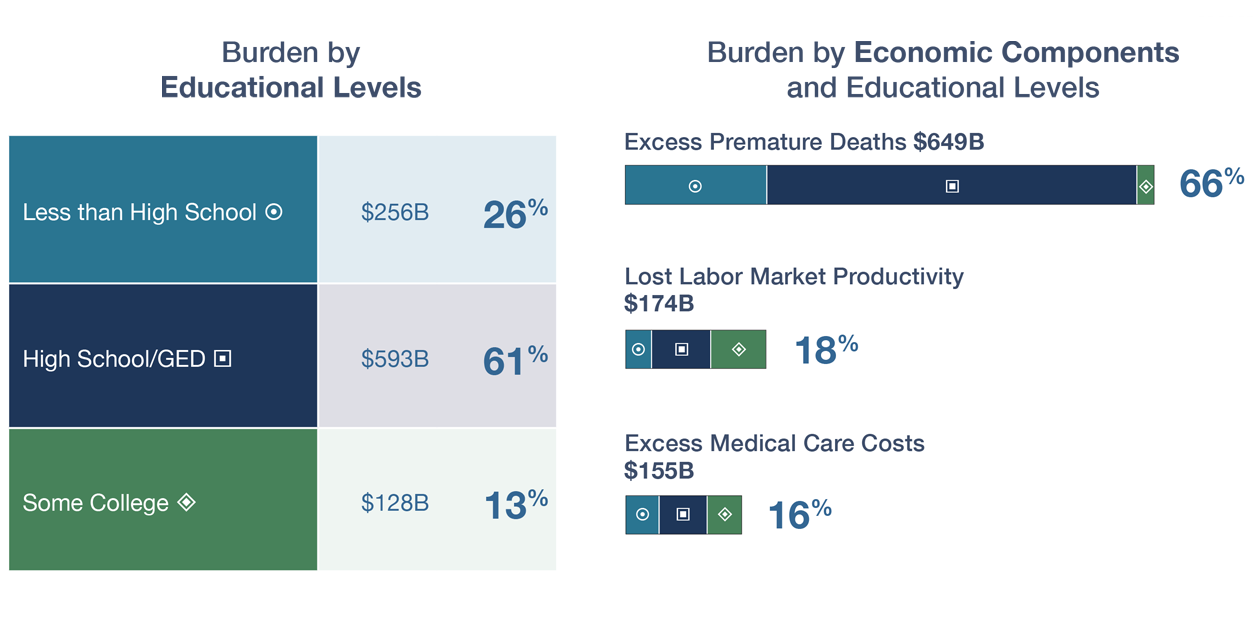
Across all educational levels, the highest to lowest burden was by:
- Premature deaths (66%)
- Lost labor market productivity (18%)
- Excess medical care costs (16%)
Burden by educational levels, most to least:
- High school/GED (61%)
- Less than high school/GED (26%)
- Some college (13%)
- Although most of the burden was borne by adults with a high school diploma/GED (61%), a disproportionate share was borne by adults with less than a high school diploma/GED—who were only 9% of the population but bore 26% of the burden.
State Estimates
Burden in states by educational levels:
- Adults with less than a high school diploma/GED had the highest burden in most states (31 states)
- Adults with a high school diploma/GED (20 states)
- Adults with some college had the lowest burden in all 50 states and the District of Columbia.
Five states with the highest burden of education-related health disparities:
- Texas ($71 billion)
- California ($59 billion)
- Florida ($57 billion)
- North Carolina ($48 billion)
- Ohio ($48 billion)
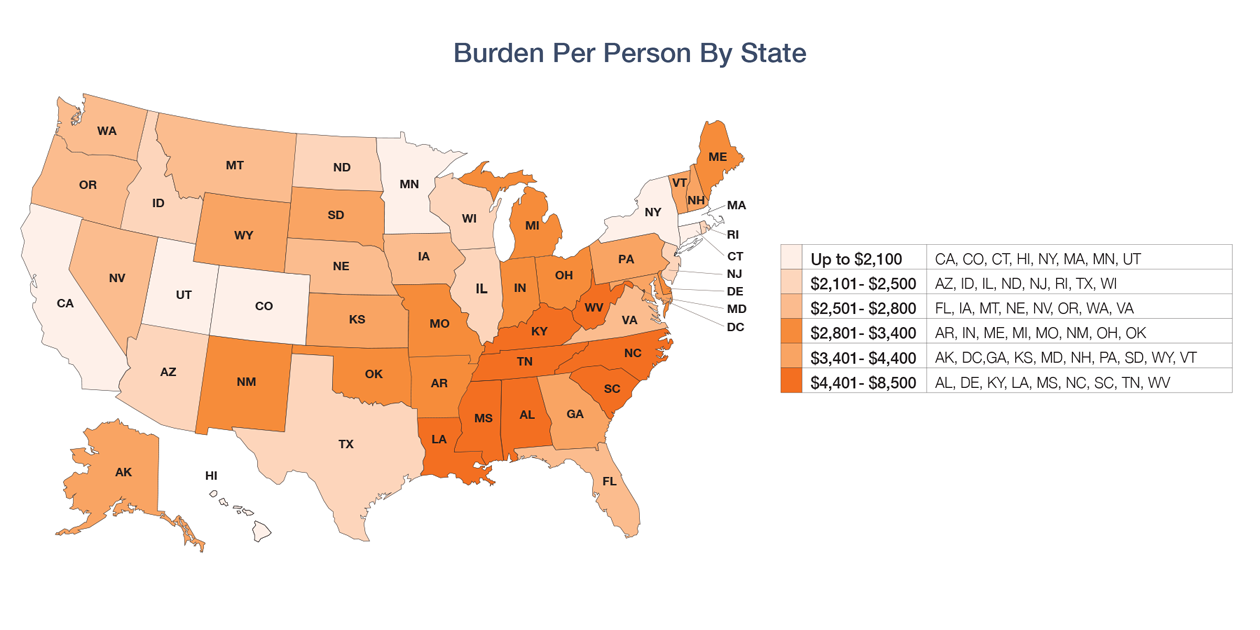
Per person, from lowest to highest, the burden varied substantially:
- $1,503 (California)
- $8,432 (South Carolina)
States with the highest and lowest burden relative to their GDP:
- Burden equivalent to 10% or more of GDP:
- South Carolina (18.29%)
- Mississippi (13.44%)
- Alabama (12.66%)
- Kentucky (12.35%)
- Arkansas (10.18%)
- Burden equivalent to less than 3% of GDP:
- District of Columbia (1.90%)
- California (1.97%)
- New York (2.14%)
- Connecticut (2.64%)
- Minnesota (2.72%)
This study is a collaboration by researchers from the National Institute on Minority Health and Health Disparities, Tulane School of Public Health and Tropical Medicine, Johns Hopkins Bloomberg School of Public Health, Uniformed Services University, TALV Corp, and National Urban League.
Citation
LaVeist, T. A., Pérez-Stable, E. J., Richard, P., Anderson, A., Isaac, L. A., Santiago, R., Okoh, C., Breen, N., Farhat, T., Assenov, A., & Gaskin, D. J. (2023). The economic burden of racial, ethnic, and educational health inequities in the US. JAMA, 329(19), 1682-1692. doi:10.1001/jama.2023.5965
Page updated Aug. 5, 2024 | published May 16, 2023


